
Sheep numbers are often quoted without the date or source that gives them meaning. This reference brings together the latest national figures from the United States Department of Agriculture in one place, so readers can quickly understand the scale of the U.S. sheep and wool sector and trace each number back to the original report.
Last updated August 15, 2026. Inventory figures are as of January 1, 2026. Lamb crop, shearing, wool production, and wool value figures are for 2025.
At a glance
National sheep and wool figures
4.99M
Sheep and lambs in the United States
January 1, 2026 inventory, down 1% from the prior year.
Source: USDA NASS, 20263.61M
Breeding sheep and lambs
January 1, 2026 inventory, including ewes, rams, and replacement lambs.
Source: USDA NASS, 20261.38M
Market sheep and lambs
January 1, 2026 inventory. Market lambs made up 94% of this group.
Source: USDA NASS, 20263.03M
Lamb crop
Lambs born or docked/branded during 2025, depending on region.
Source: USDA NASS, 2026105
Lambs per 100 ewes
National 2025 lambing rate, measured against ewes one year old and older on January 1, 2025.
Source: USDA NASS, 20263.00M
Sheep and lambs shorn
United States total during 2025, including shearing at commercial feeding yards.
Source: USDA NASS, 202620.5M lb
Shorn wool production
United States production during 2025, down 5% from 2024.
Source: USDA NASS, 202628%
Hair sheep or wool-hair crosses
Share of the January 1, 2026 national sheep and lamb inventory.
Source: USDA NASS, 2026What the figures show
A compact national flock, with wool still part of the picture
The January 1 inventory separates breeding sheep and lambs from market animals. That distinction matters when readers are comparing the breeding base of the national flock with animals held for market. The same annual release also pairs the inventory figures with the prior year's lamb crop and wool results, making it a useful source for a concise view of the sector.
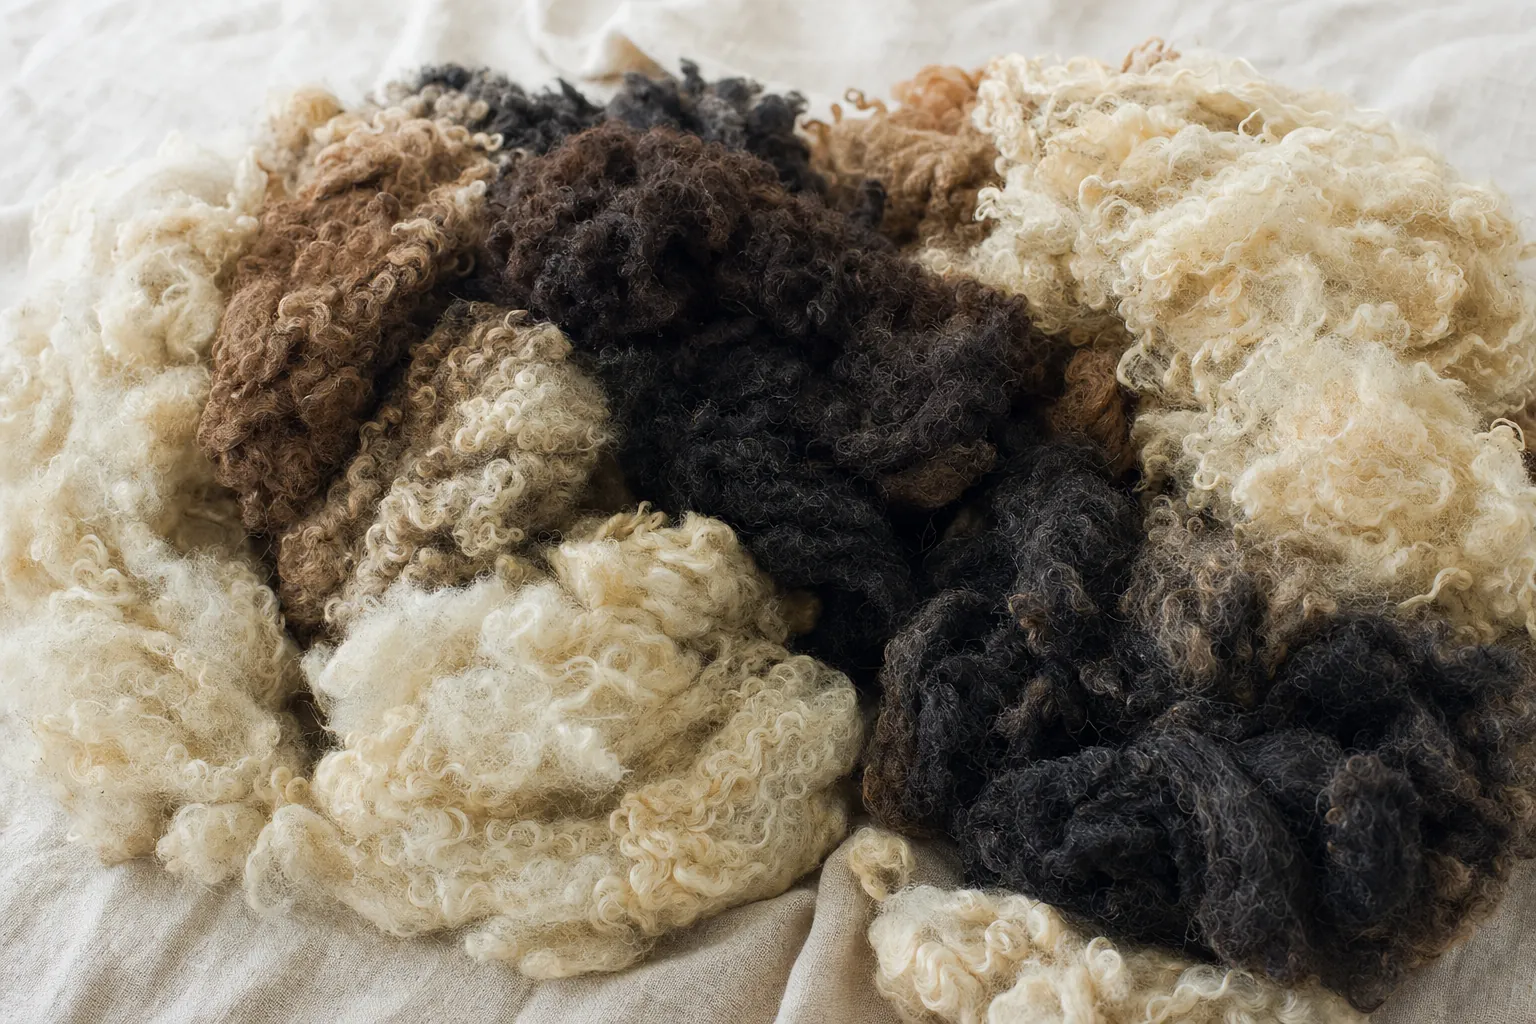
For people drawn to a fleece-bearing breed such as the Harlequin, the wool figures are especially useful context. They show a national wool clip of 20.5 million pounds in 2025 from 3.00 million shorn sheep and lambs. Harlequin sheep are one distinctive part of that larger American sheep story, stewarded through careful breeding, documented records, and the people who keep small flocks well.
Explore HSSR's Harlequin sheep breed standard or connect with the Society's member breeder directory to learn more about the breed behind the fleece.
Method and sources
How to read and reuse this page
All figures above come from one official annual release by the USDA National Agricultural Statistics Service. The source reports the United States total, uses its own definitions for each category, and publishes the underlying state-level tables alongside the national results. This page does not estimate or combine figures from different reports.
- USDA National Agricultural Statistics Service, Sheep and Goats, released January 30, 2026
National flock inventory as of January 1, 2026, plus 2025 lamb crop, shearing, and wool production.
Cite this page
Make the source easy to trace
When referring to a figure from this page, include the date and link directly to the statistic when possible. Each figure above has a permanent section anchor.
Harlequin Sheep Society & Registry. “U.S. Sheep & Wool Statistics: 2026 Reference.” Updated August 15, 2026. https://harlequinsheepsociety.com/sheep-industry-statistics